Every cryptocurrency, ranked by what it's worth
Market gauges
Calculated from current prices.
Altcoin season
Share of the top 100 coins beating Bitcoin over 90 days.
How it's scored
Stablecoins and gold tokens are left out. 75 or more means altcoin season; 25 or less means Bitcoin season.
KryptoKap 10
The ten largest coins, weighted by market cap.
How it's built
Started at 1,000. Stablecoins and gold tokens excluded. Members are the ten largest coins at each update, and the divisor adjusts when they change so the line stays continuous.
Bitcoin halving
Every 210,000 blocks, the reward for mining new Bitcoin is cut in half.
How it's estimated
Bitcoin aims for one block every 10 minutes, so the date is the remaining blocks × 10 minutes. Real block times vary, so the estimate drifts by days.
DeFi
Total value locked: money deposited in lending, trading and staking apps, and where it lives.
Total value locked
By chain
Stablecoins
Digital dollars: how many exist, who issues them, and whether each one is holding its $1 peg.
Total supply
Issuers and pegs
| Coin | Supply | Share | Price |
|---|
Market map
Coins grouped by sector. Circle size is market cap, color is the move since the start of the week. Press play to replay the week.
The week's race
The ten biggest coins over the last 7 days.
Milestones
Flippenings and market cap thresholds, logged as they happen.
Daily recaps →Week in review →Headlines
The latest crypto news from major outlets, linked to the coins they mention.
| # | Coin | Price | 1h | 24h | 7d | Market cap | Volume 24h | Supply | Last 7 days |
|---|
Tools
Calculators for prices, market caps, history and risk, using live data.
Past investment
What money put into a coin on a past date is worth today.
DCA simulator
Buying a fixed amount on a schedule, compared with putting it all in on day one.
Price target
What a target price would mean for a coin's market cap.
Convert
Any coin to dollars or to another coin, at live prices.
Compare coins
Side-by-side price, size, supply and performance.
What if
The price a coin would have with another coin's market cap.
Closest races
Neighbours nearest to swapping rank (stablecoins excluded).
Return check
What a past buy is worth at today's price.
Position size
How much to buy so a stop-out loses only what you choose.
A stop-loss isn't guaranteed. Gaps and slippage can fill past your stop and make the loss bigger.
Dilution check
Circulating vs. maximum supply, and the cap if every coin existed.
Average cost
Your weighted average price across several buys.
Break-even
The selling price that gets your money back after fees.
Comeback
The gain needed to recover from a drop.
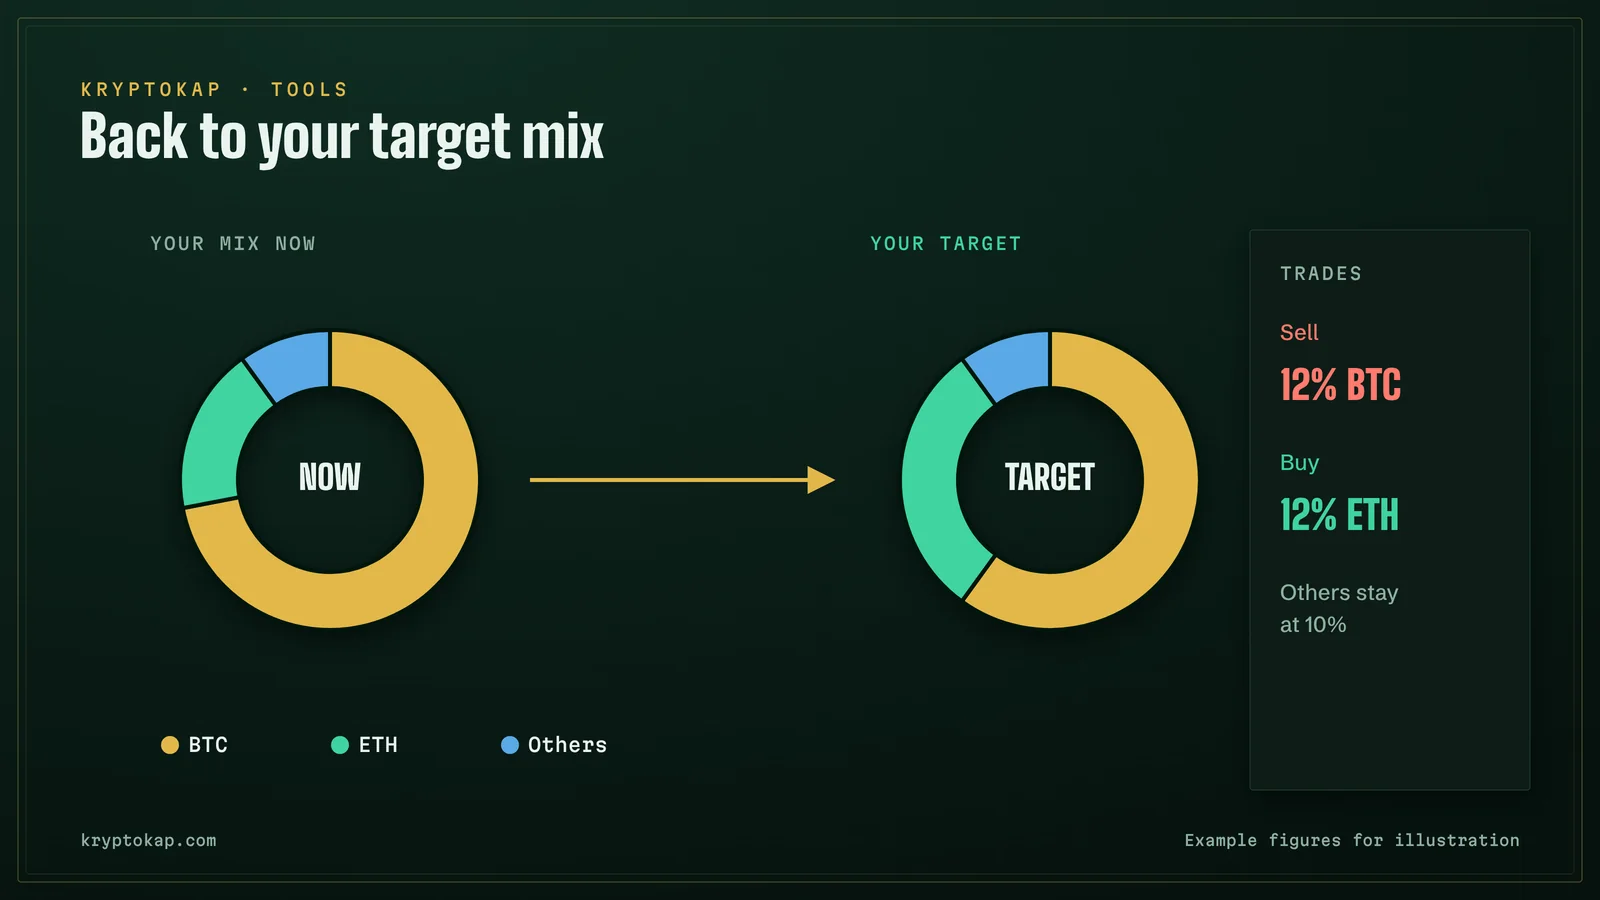
Rebalancer
Trades needed to get back to your target mix.
| Coin | Now | Target % | Trade |
|---|