Started at 1,000. Stablecoins and gold tokens excluded. Members are the ten largest coins at each update, and the divisor adjusts when they change so the line stays continuous.
Countdown
Bitcoin halving
Every 210,000 blocks, the reward for mining new Bitcoin is cut in half.
Calculators for prices, market caps, history and risk, using live data.
History
Past investment
What money put into a coin on a past date is worth today.
Your investmentSame money in BitcoinMoney put in
Steady buying
DCA simulator
Buying a fixed amount on a schedule, compared with putting it all in on day one.
Steady buyingAll on day oneMoney put in
Leverage
Leveraged ETF calculator
What a fund that resets its leverage every day would have returned, next to the coin itself.
Daily-reset fundThe coin itselfSimply 2x the return
Reality check
Price target
What a target price would mean for a coin's market cap.
Converter
Convert
Any coin to dollars or to another coin, at live prices.
Head to head
Compare coins
Side-by-side price, size, supply and performance.
Market cap comparison
What if
The price a coin would have with another coin's market cap.
Flippening watch
Closest races
Neighbours nearest to swapping rank (stablecoins excluded).
Dominance
Market share
Share of total crypto market cap.
Profit & loss
Return check
What a past buy is worth at today's price.
Risk
Position size
How much to buy so a stop-out loses only what you choose.
A stop-loss isn't guaranteed. Gaps and slippage can fill past your stop and make the loss bigger.
Supply
Dilution check
Circulating vs. maximum supply, and the cap if every coin existed.
Investing
Average cost
Your weighted average price across several buys.
Investing
Break-even
The selling price that gets your money back after fees.
Risk
Comeback
The gain needed to recover from a drop.
Start
After drop
Investing
Rebalancer
Trades needed to get back to your target mix.
Coin
Now
Target %
Trade
Today's crypto prices by market cap
Exchange data · Hyperliquid
Hyperliquid open interest
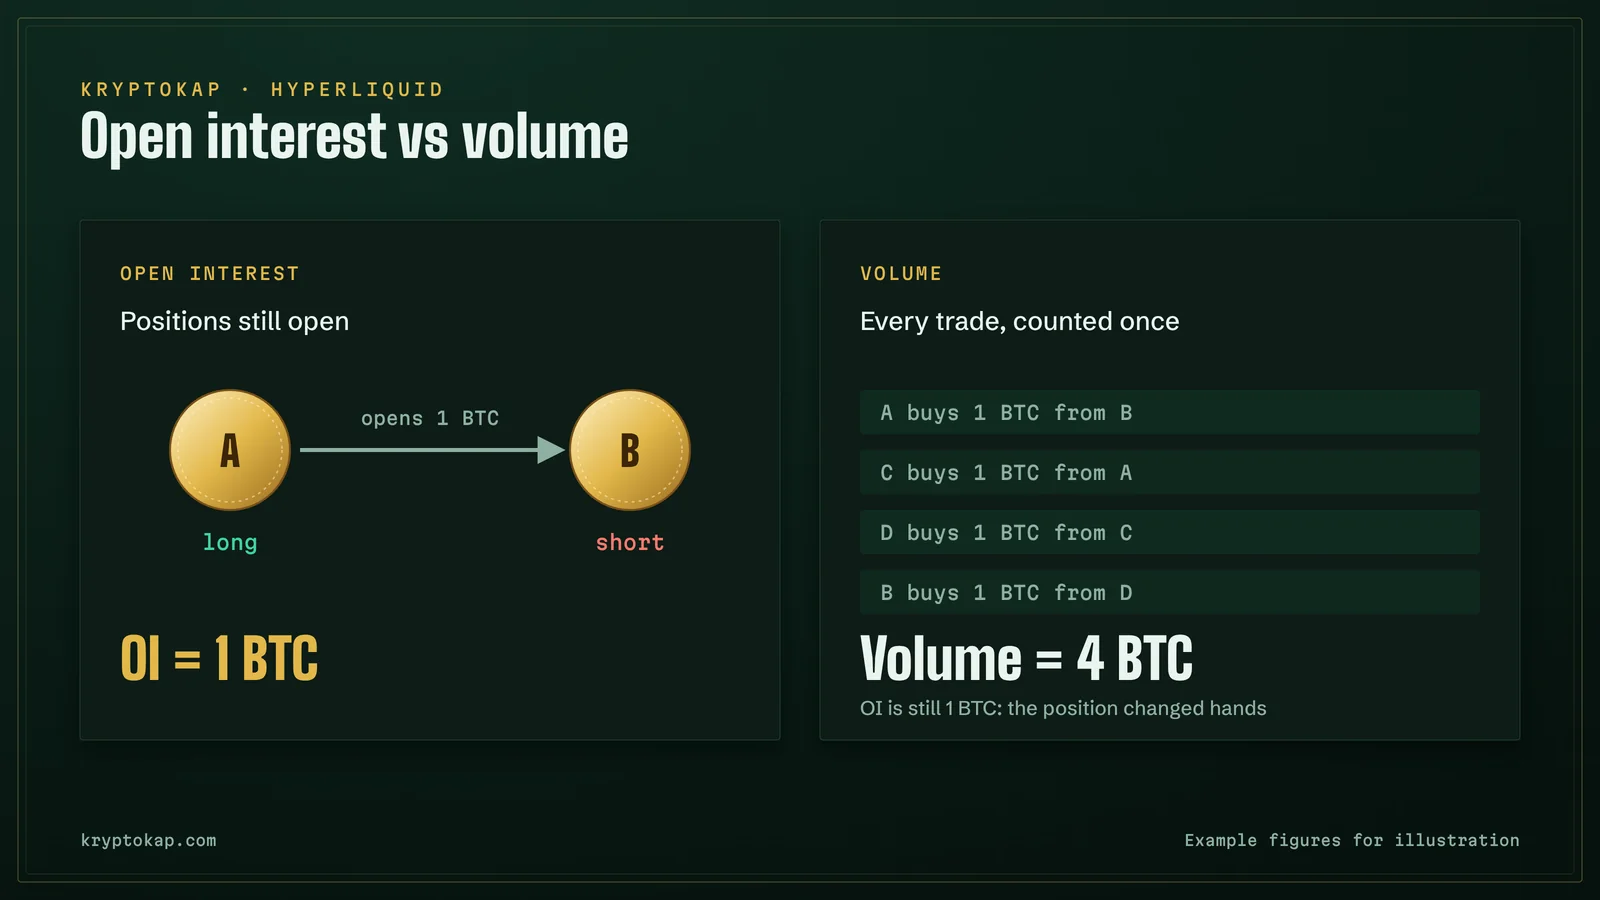
Open interest is the value of every position still open on a market. Volume counts trades; open interest counts bets that haven't been closed yet, so it shows where money is actually positioned on Hyperliquid right now.
Read from Hyperliquid 26 minutes ago (20:39 UTC) · refreshed every 30 minutes, not live tick by tick
Total open interest$6.3B
24h volume$4.4B
Volume ÷ open interest0.69×how many times positions turned over
Who holds the open interest
Top 8 markets86.2% of all open interest
BTC $2.5B 39.4%
HYPE $1.2B 18.3%
ETH $1.1B 16.8%
SOL $285.6M 4.5%
ZEC $217.9M 3.5%
NEAR $95.1M 1.5%
LIT $68.8M 1.1%
XMR $67.0M 1.1%
The other 171 markets
KryptoKap started storing a daily reading of Hyperliquid's open interest on November 22, 2026. A day-by-day chart appears here once three days are stored.
Every market
Open interest on every Hyperliquid market. Column headings sort the table.
Live figures from Hyperliquid's public market data, last read Nov 22, 2026, 20:39 UTC. KryptoKap reads it every 30 minutes and isn't affiliated with Hyperliquid. How these numbers are worked out. Not financial advice: perpetual futures with leverage can lose more than you expect, fast.
Positions compares the number of coins held in open positions with the day before, so it shows traders opening or closing. Value also moves with the price: if Bitcoin rises 5% and nobody trades, its open interest value still rises 5%. Both columns fill in once two days are stored.
What open interest tells you
Open interest counts positions still open. Volume counts every trade, so it can be many times larger without open interest changing.
Rising open interest with a rising price means new money is opening longs. Rising open interest with a falling price means new shorts. When open interest drops sharply in an hour or two, positions were closed in a hurry, often by liquidations.
Volume divided by open interest shows how busy a market is compared with its size. A ratio well above 1× means positions are turning over quickly, which is common in new or heavily traded meme coins. A low ratio means traders are holding positions rather than flipping them.
Open interest on Hyperliquid is shown in dollars at the current mark price. The exchange reports it in coins, so a market's dollar figure moves with its price even when nobody opens or closes a position.
Questions
Is high open interest bullish?
Not by itself. Every open position has a long and a short side of the same size, so open interest measures how much is at stake, not which way it leans. Funding rates show better which side is more crowded.
Why does open interest fall during a crash?
Liquidations close positions automatically when margin runs out, and other traders close theirs to cut losses. Both remove open interest, which is why sharp moves in price and open interest often come together.