Started at 1,000. Stablecoins and gold tokens excluded. Members are the ten largest coins at each update, and the divisor adjusts when they change so the line stays continuous.
Countdown
Bitcoin halving
Every 210,000 blocks, the reward for mining new Bitcoin is cut in half.
Calculators for prices, market caps, history and risk, using live data.
History
Past investment
What money put into a coin on a past date is worth today.
Your investmentSame money in BitcoinMoney put in
Steady buying
DCA simulator
Buying a fixed amount on a schedule, compared with putting it all in on day one.
Steady buyingAll on day oneMoney put in
Leverage
Leveraged ETF calculator
What a fund that resets its leverage every day would have returned, next to the coin itself.
Daily-reset fundThe coin itselfSimply 2x the return
Reality check
Price target
What a target price would mean for a coin's market cap.
Converter
Convert
Any coin to dollars or to another coin, at live prices.
Head to head
Compare coins
Side-by-side price, size, supply and performance.
Market cap comparison
What if
The price a coin would have with another coin's market cap.
Flippening watch
Closest races
Neighbours nearest to swapping rank (stablecoins excluded).
Dominance
Market share
Share of total crypto market cap.
Profit & loss
Return check
What a past buy is worth at today's price.
Risk
Position size
How much to buy so a stop-out loses only what you choose.
A stop-loss isn't guaranteed. Gaps and slippage can fill past your stop and make the loss bigger.
Supply
Dilution check
Circulating vs. maximum supply, and the cap if every coin existed.
Investing
Average cost
Your weighted average price across several buys.
Investing
Break-even
The selling price that gets your money back after fees.
Risk
Comeback
The gain needed to recover from a drop.
Start
After drop
Investing
Rebalancer
Trades needed to get back to your target mix.
Coin
Now
Target %
Trade
Today's crypto prices by market cap
Exchange data · Hyperliquid
Hyperliquid funding rates
Funding is what keeps a perpetual future close to the coin's price: each hour the crowded side pays the other. Here is every Hyperliquid market's current rate, next to the same coin on Binance and Bybit, all converted to the same hourly basis.
Read from Hyperliquid 26 minutes ago (20:39 UTC) · refreshed every 30 minutes, not live tick by tick
Longs pay the mostNEAR +11.0%a year at this hour's rate
Shorts pay the mostCRV −70.7%a year at this hour's rate
Markets where longs pay114 of 179
Hyperliquid settles funding every hour, on the hour (UTC).
"Highest" and "lowest" only count markets with at least $5M of open interest, so tiny markets with extreme rates don't crowd the list.
Funding over the last 60 days
The daily average of each hour's rate, shown as a yearly figure. Long stretches above zero mean longs kept paying to stay in; dips below zero show when the mood turned.
Funding heatmap, last 30 days
Each square is one market's average funding for a whole UTC day. Green means longs paid, coral means shorts paid, and the stronger the colour the bigger the rate, up to ±30% a year. Read across a row to see a market's run, or down a column to see whether the whole market leaned the same way that day.
Oct 24−30% 0 +30% a yearNov 22
Every market, three exchanges
Yearly figures assume a rate holds for a full year, which it never does: they make rates paid on different schedules easy to compare, not a forecast of what anyone will earn or pay. The 7-day average, for the biggest markets, smooths out single hours. Binance and Bybit figures are each exchange's predicted rate for its next settlement, as reported through Hyperliquid's data; Hyperliquid's is the current hourly rate. A dash means the coin isn't listed on that exchange as a perpetual.
Funding on Hyperliquid, Binance and Bybit for every market. Column headings sort the table.
Funding on the 10 busiest stock, index and commodity markets, run by independent operators. Every one is on the stocks page.
Market
Operator
Funding, 1h
Funding, yearly
Open interest
XYZ100
XYZ
−0.0003%
−2.2%
$398.2M
SP500
XYZ
+0.0006%
+5.5%
$492.8M
NVDA
XYZ
+0.0023%
+20.6%
$516.4M
SKHX
XYZ
−0.0046%
−40.2%
$268.2M
ANT
XYZ
+0.0033%
+28.5%
$247.3M
SOXL iso
XYZ
−0.0118%
−103.1%
$91.8M
GOOGL
XYZ
+0.0006%
+5.5%
$135.4M
CL
XYZ
+0.0006%
+5.5%
$142.0M
MU
XYZ
−0.0002%
−1.8%
$148.2M
GOLD
XYZ
−0.0023%
−19.9%
$261.0M
Live figures from Hyperliquid's public market data, last read Nov 22, 2026, 20:39 UTC. KryptoKap reads it every 30 minutes and isn't affiliated with Hyperliquid. How these numbers are worked out. Not financial advice: perpetual futures with leverage can lose more than you expect, fast.
How Hyperliquid works out funding
Each rate has two parts. The premium measures how far the perpetual is trading above or below the oracle price, sampled every five seconds and averaged over the hour. On top of that sits a fixed interest component of 0.01% every eight hours, which is 0.00125% an hour, or about 11% a year paid by longs to shorts when the premium is zero. Hyperliquid pays funding every hour. Its funding page has the full formula, and the funding rates lesson explains it from the start.
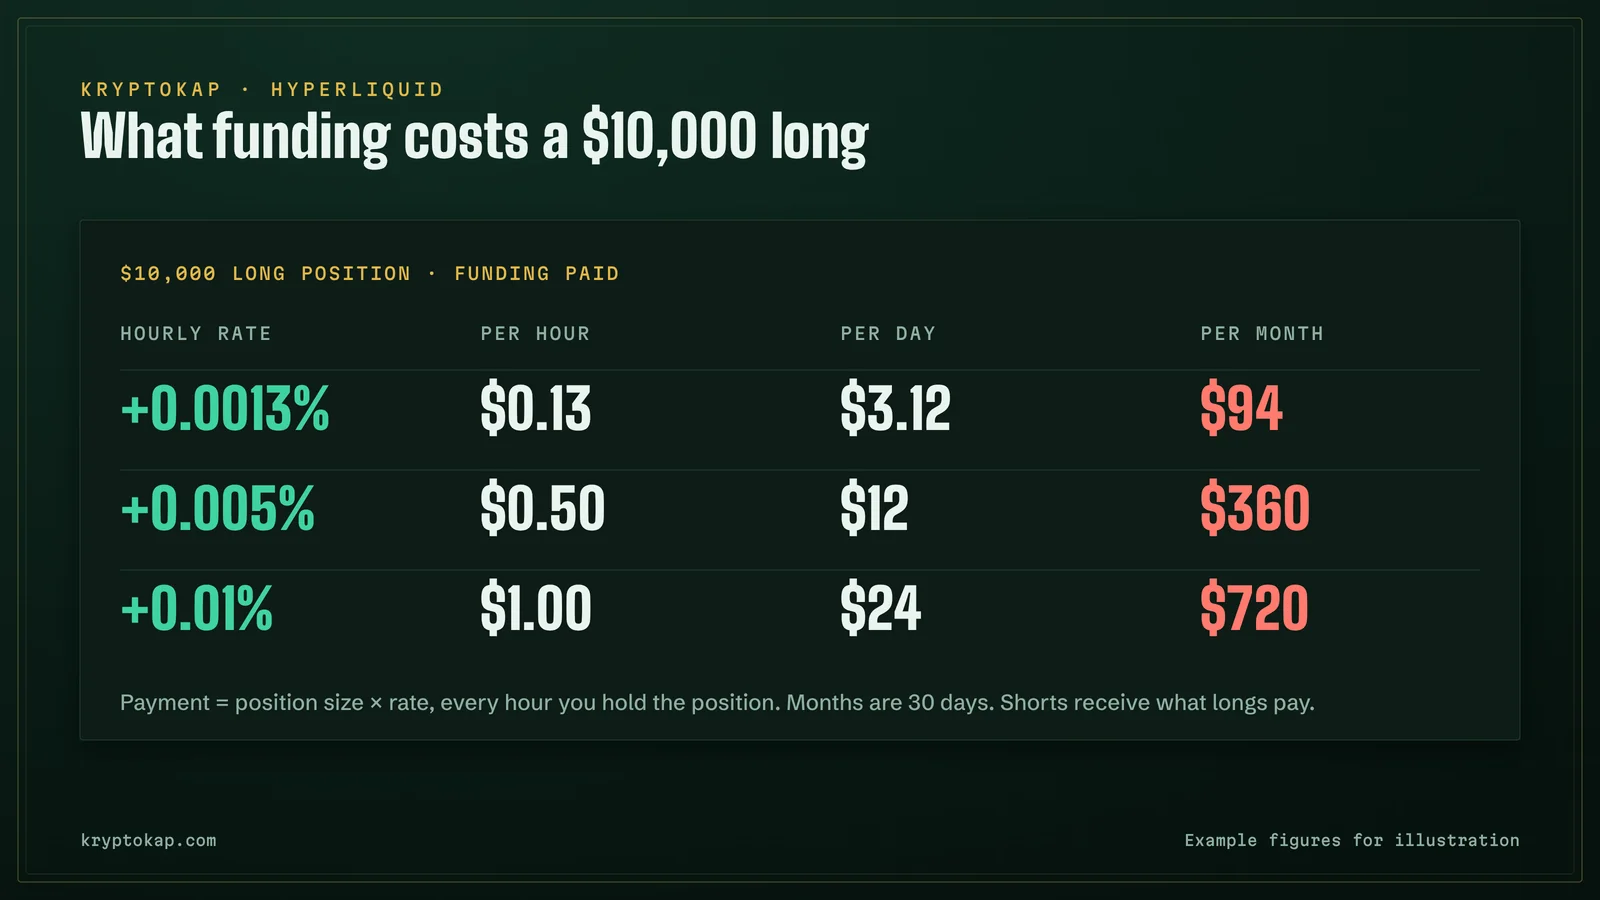
The payment is your position size times the oracle price times the rate. A $10,000 long at +0.0013% an hour pays about $0.13 an hour, a little over $3 a day. At +0.01% an hour, which happens in excited markets, the same position pays $24 a day.
At a calm +0.0013% an hour, funding on a $10,000 long is about $3 a day. In an excited market at +0.01% an hour, it's $24 a day.
Reading the gap between exchanges
When Hyperliquid's rate is well above Binance's for the same coin, Hyperliquid's traders are leaning harder long than the wider market. Some traders try to collect the difference by going long where funding is lower and short where it's higher. That isn't free money: prices on the two venues can drift apart, rates change every hour, and you pay trading fees four times to open and close both sides.
Questions
Who pays funding when the rate is positive?
Longs pay shorts. A negative rate means shorts pay longs. You only pay or receive funding while you hold a position at the moment it's settled, which on Hyperliquid is every hour.
Why do Binance and Bybit show different funding for the same coin?
Each exchange has its own traders, its own formula and its own schedule, usually every four or eight hours. KryptoKap divides every rate by its interval so they're all hourly, then multiplies by the hours in a year for the yearly column.
Is a high funding rate a sign the price will fall?
Not on its own. High funding shows that traders are paying a lot to stay long, which makes a crowded trade more fragile, but crowded trades can stay crowded for a long time.